All Projects
Digital Plant
Production Line OEE Dashboard
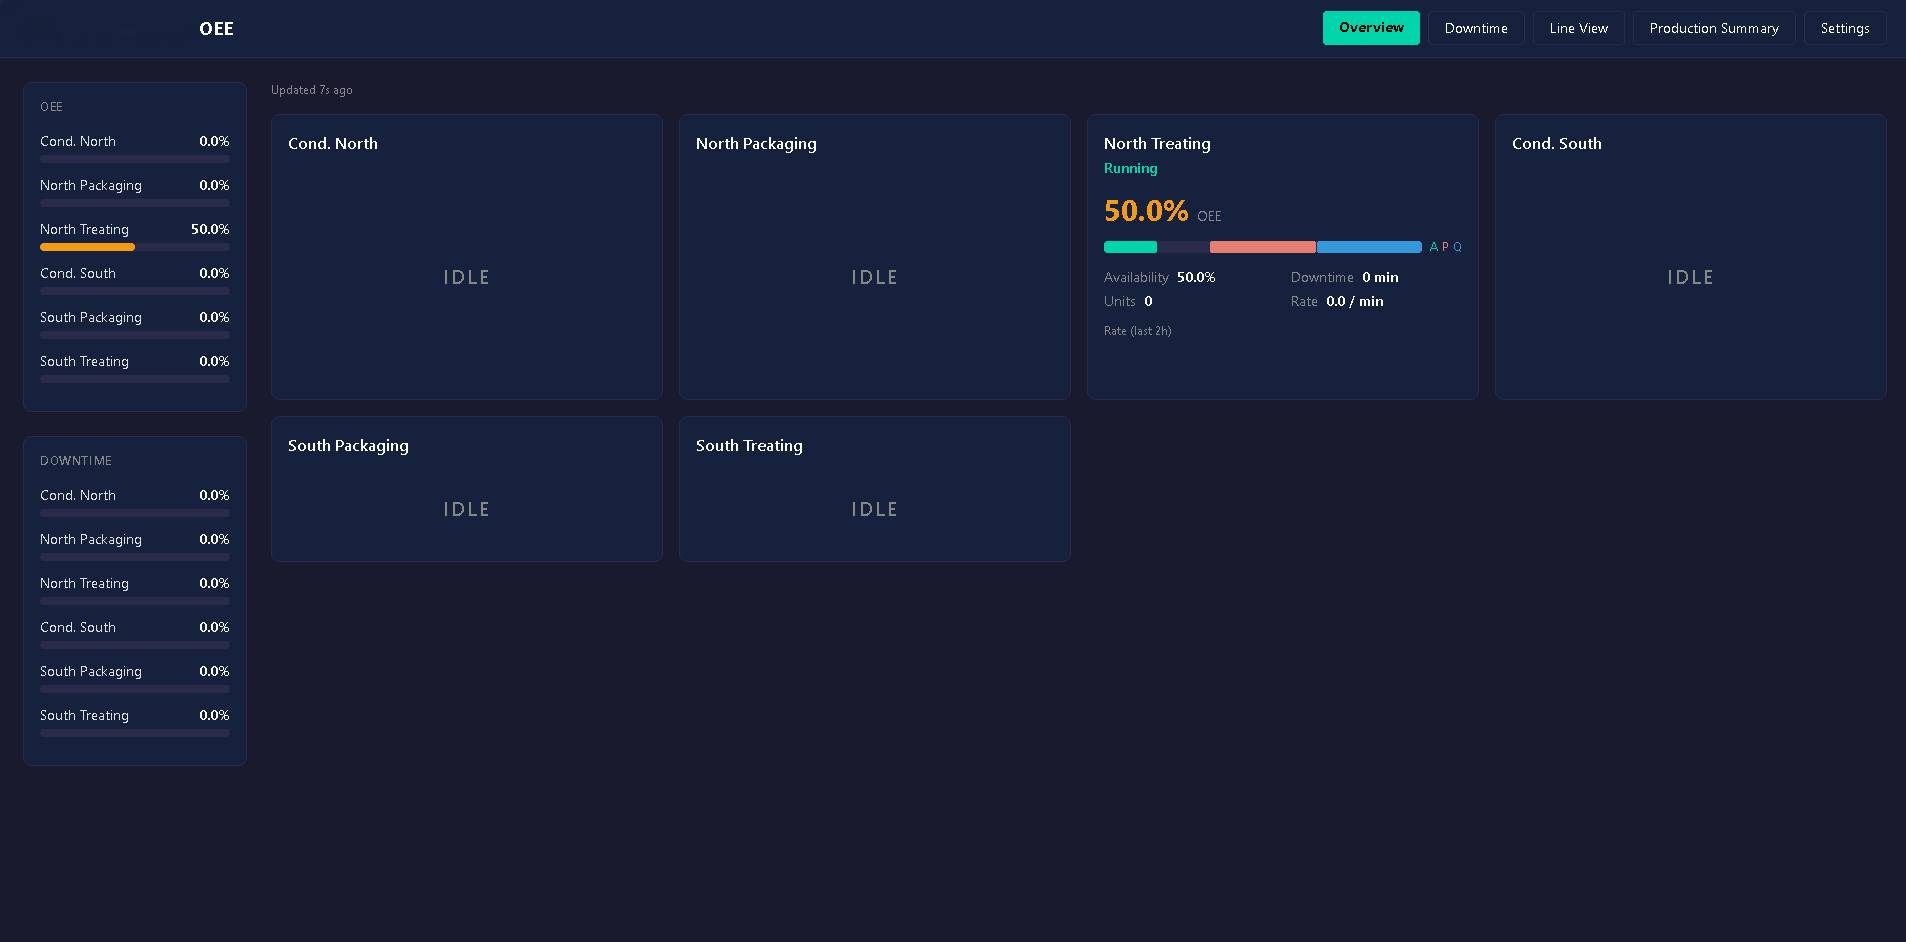
A real-time OEE dashboard built on an existing Ignition MES, giving plant leadership live visibility into line performance and downtime across multiple production lines.
The Challenge
Plant leadership had no real-time view of how well production lines were performing. Downtime causes were hard to quantify, and any new monitoring solution needed to run without adding operator data-entry burden.
How We Solved It
- 01Built the OEE Dashboard directly on top of the plant's existing Ignition MES platform — no new hardware or PLC changes required
- 02Configured Ignition to automatically capture every machine state change (Running, Stopped, E-Stop, Blocked, Starved, Changeover, Equipment Fault) with start/end timestamps, down to the second
- 03Calculated Availability, Performance, and Quality continuously throughout each production run to produce a live OEE score, color-coded green/amber/red against defined thresholds
- 04Delivered a four-page web dashboard — Overview, Line View, Downtime Analysis, and Production Summary — covering everything from a plant-wide glance to Pareto/MTBF/MTTR root-cause analysis
- 05Made the dashboard read-only against the production database so it can never interfere with Ignition or live operations
The Result
Plant managers and leadership now have a live, browser-based view of every line's status and OEE score, refreshed automatically every 60 seconds. Downtime causes are ranked by total duration and frequency, making it immediately clear where losses are concentrated and where to focus improvement efforts — all without any manual operator data entry.
Technologies Used
Ignition MESIgnition PerspectiveSQL ServerOEE (Availability / Performance / Quality)